Description
This is a tool for Google Analytics for managing multiple websites on a single platform. To identify trends and patterns in how visitors interact with the websites, data from various matrices are collected and used to create the reports. Charts are used to present the overview and visual presentation. With a SaaS version, create plans using a Super Admin Login.


Features
- A visually attractive dashboard to understand visitors’ activities
- Add multiple websites
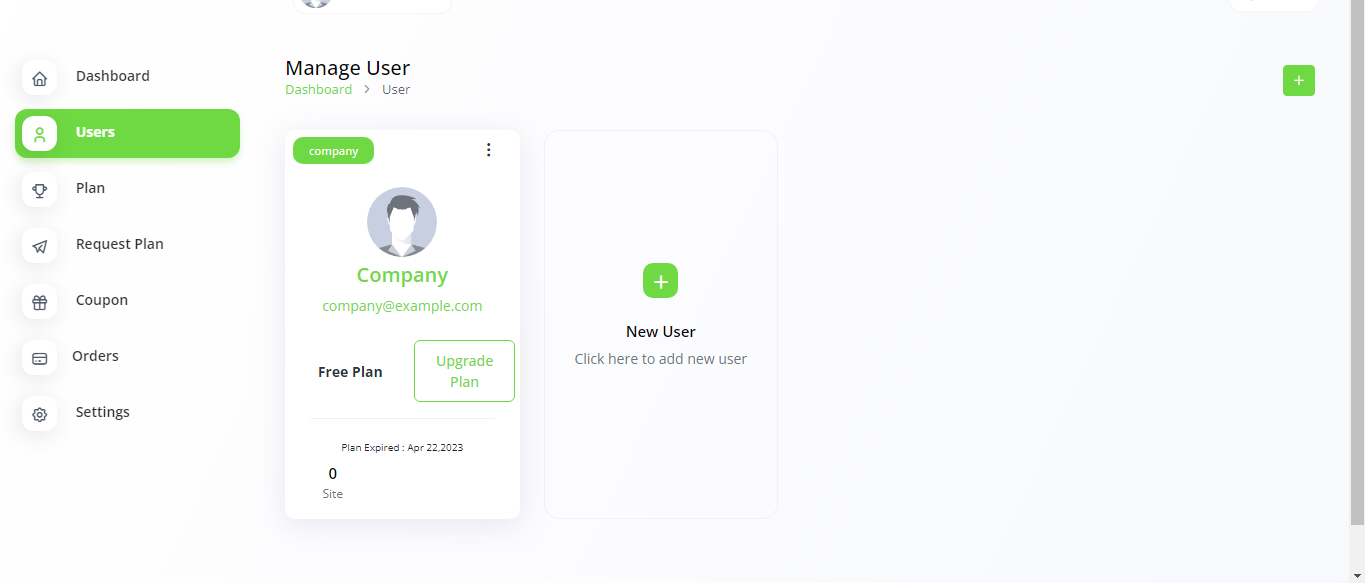
- Restriction on users’ permissions
- New Visitors and Returning Visitors Based on Week / Month / Year
- Users / Bounce Rate / Session Duration
- All Users by Location
- Live Active Users via Real-time API V4
- Top Active Pages
- Sessions by Device Type
- Quick views of the websites
- Widgets for numerical data
- Analytics on various types like Channels, Audiences, Pages, and SEO
- Custom Charts from the Matrices & Dimension
- Customized settings options for RTL on/off, Primary Color, Sidebar, Layout
- Themes Color Setting, Transparent Layout, and Dark Layout under Theme Customizer
- A user-friendly RTL experience for customers using Arabic, Hebrew, and Urdu-like languages
- Any of the plans’ payments can be done using 10 diverse payment gateways namely Stripe, PayPal, Paystack, Flutterwave, Razorpay, Paytm, Mollie, Skrill, Mercado Pago, CoinGate, Paymentwall
- Built with Laravel 9
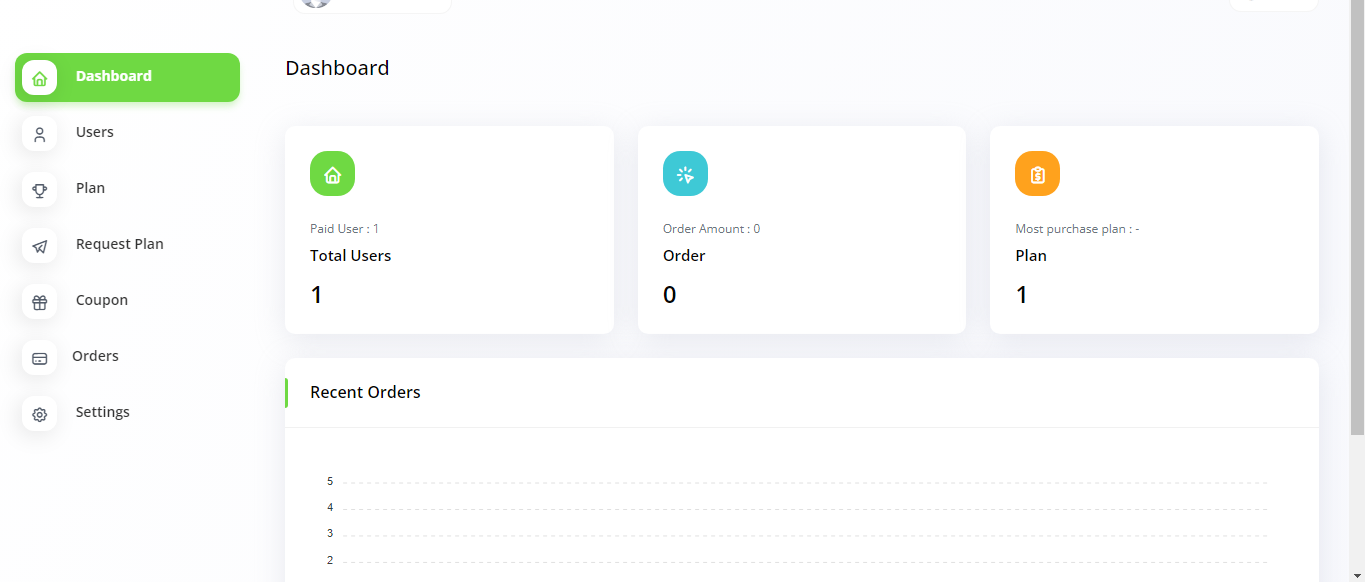
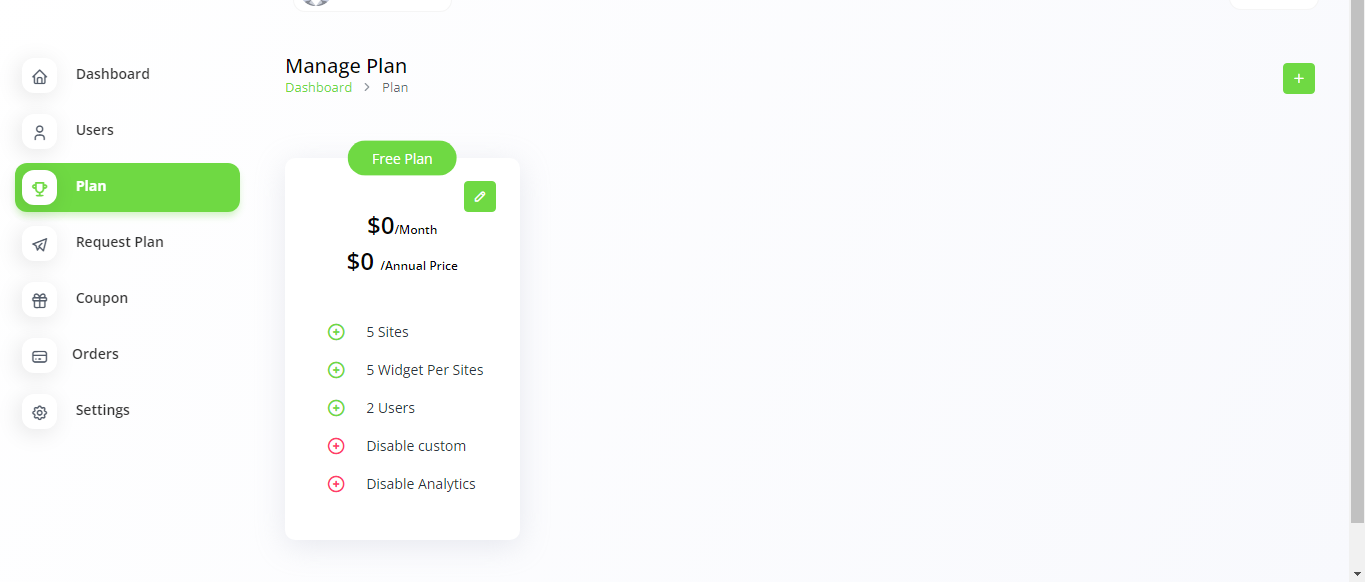
Create plans and get payment – a unique SaaS Feature
With a Super Admin Login, create the most feasible plans for your business model. Select appropriate pricing and duration for the created plan. Make payments using various payment gateways. The plan would be disabled if not renewed after its expiry.
Dashboard
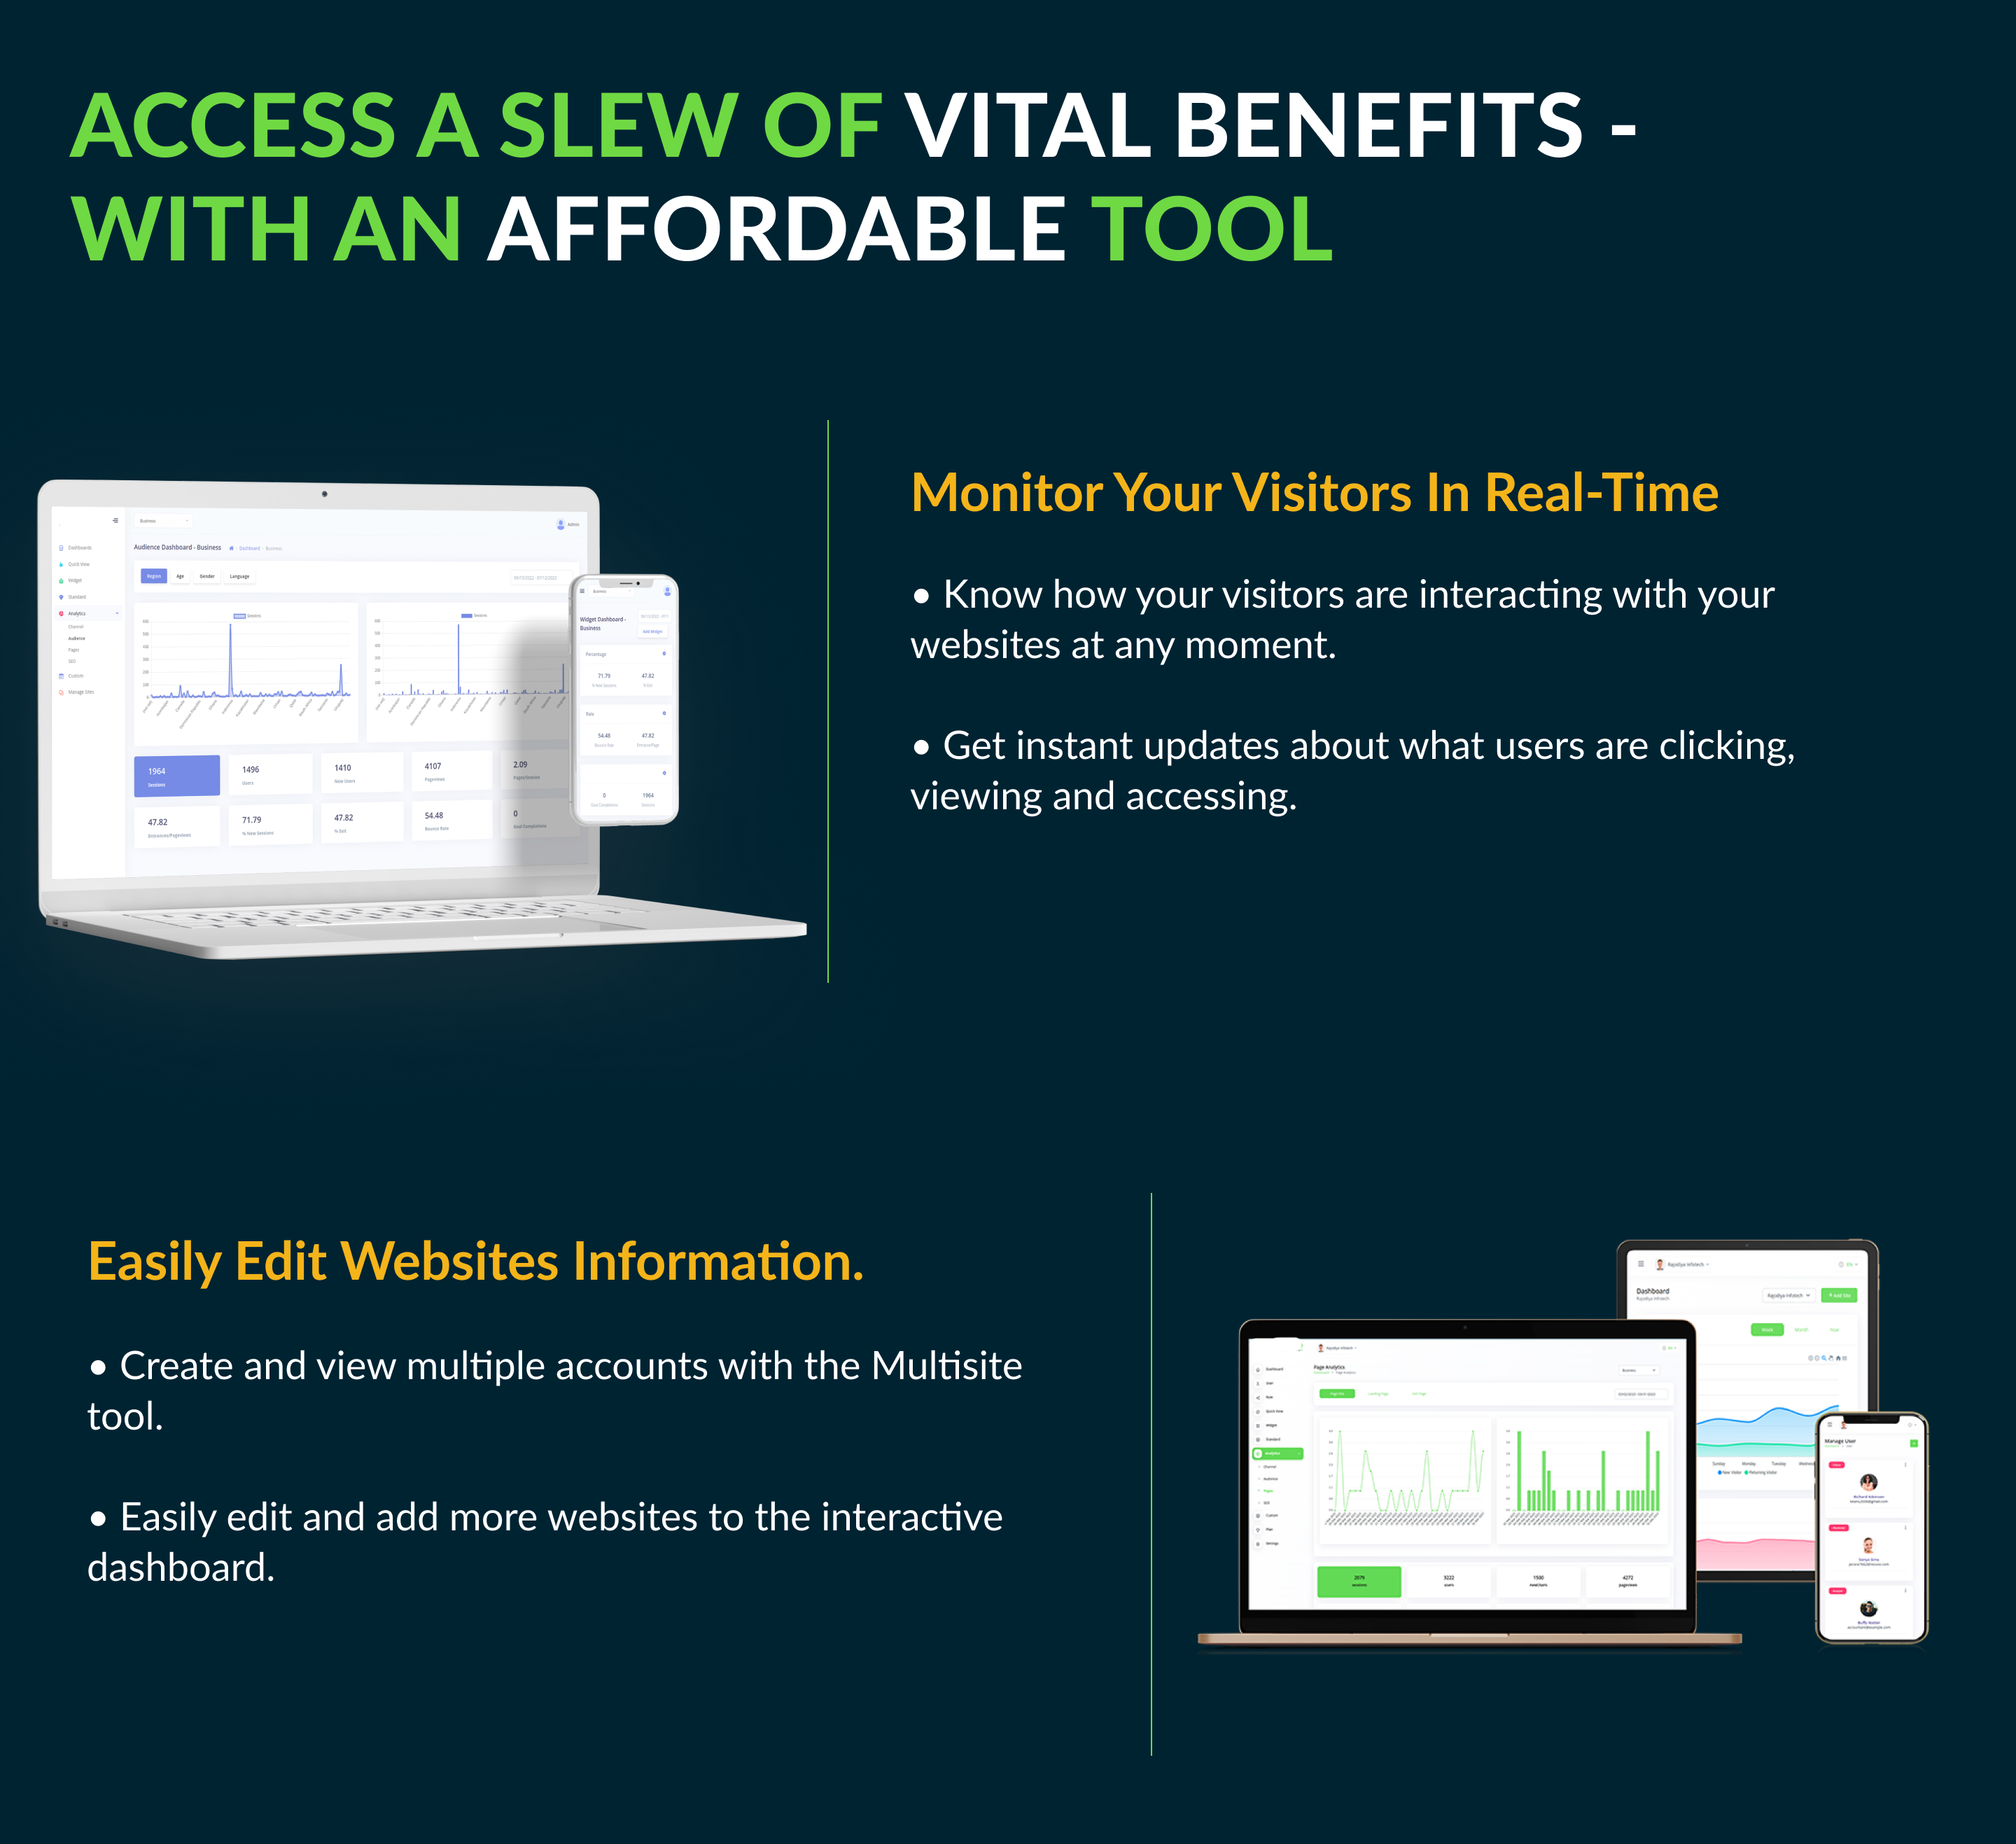
A well-organized dashboard that represents the weekly/ monthly/ yearly graphs of new visitors and returning visitors for analyzing consistency. It also pictures live active users from diverse locations as well as the sessions from the devices used along with the session durations and clicks on the active pages.
Add Credential File
The credential file here is to add the very first step for the websites to work. To move ahead with this, the credential file is to be added from the console.cloud. After filling in the required details of the OAuth account, a unique JSON file will be generated. The user has to download and submit the file for further processing.
Add Site
This feature helps to add more than one websites which already been created in Google Analytics with their Account, Property, and View details according to the requirements of the website(s).
Assign roles to each user
Our multi-user accounting tool allows you to assign roles to each of your staff. By managing their permissions gain control over their access to certain parameters.
Realtime API V4
Get user activity occurring on websites right now. Real-time reports are updated within seconds so you can build live dashboards to monitor how users interact with your websites at any moment.
Quick View
The quick view feature allows the user to have a graphical representation in line or bar graphs of your multiple websites. The specific value can be seen by hovering over the graph. The graphs can be modified in following the needs of the user more likely, according to the Websites, Time frame, Top and Bottom Left and Right with the already provided matrix. The color of the Chart can also be changed by the user from the Color picker.
The most important use of the quick view feature, in this case, is to assist the user in comparing multiple websites using the various matrices that Google Analytics has already provided. The websites can be compared using multiple criteria determined by the user.
Widget
The widget feature helps the user to get the numerical data of the websites based on the pre-existing matrices and can be customized as per the time duration. When a new widget is added, the chosen matrix is fetched from the website’s existing matrices data. The widget feature is most useful for getting analytics in numbers so you can quickly analyze them without having to use a graphical representation.
Analytics
The user can conduct a more thorough analysis of the websites using additional unique and specific types in addition to the quick view and widget for a more in-depth and comprehensive analysis.
Here are those types:
Channel Analytics
The channel analysis is based on how the search was carried out on the added websites. Namely, Organic Search, Paid Search, Bounce, Referrals, Converters, and Others. The user can check the result of the analysis with the specific time duration by filtering them with the pre-existing matrices.
Audience Analytics
The audience analytics is based on how the search was carried out on the added websites in particular locations. The user can check with the specific time duration and the filtering of the pre-existing matrices also on the base of Region, Organic Search, Paid Search, and Bounce.
Pages Analytics
The pages analytics helps the user to get the analytics on the added websites for a specific time duration according to the pages of the websites. It broadly includes a Page Title, Landing Page, and Exit Page with the help of the pre-existing matrices.
SEO Analytics
The SEO Analytics shows the result of the websites from the search of Keywords, On Social Networking sites, Sources, Browsers, Operating Systems, and Devices with the specific time duration and help of the pre-existing matrices.
Custom Chart
The Custom Chart is presented in the bars with the definite matrices and dimensions for the required time duration.
Settings
Customize your site setting by adding the files of the logo and creating the text for the title. While installing the project, the backend will generate the authorized redirect URL which will be in the System Settings and must be linked with the console.cloud account to move ahead with the project.


